kmux

kmux is a tool for executing common Kubernetes actions on one or many clusters at the same time.
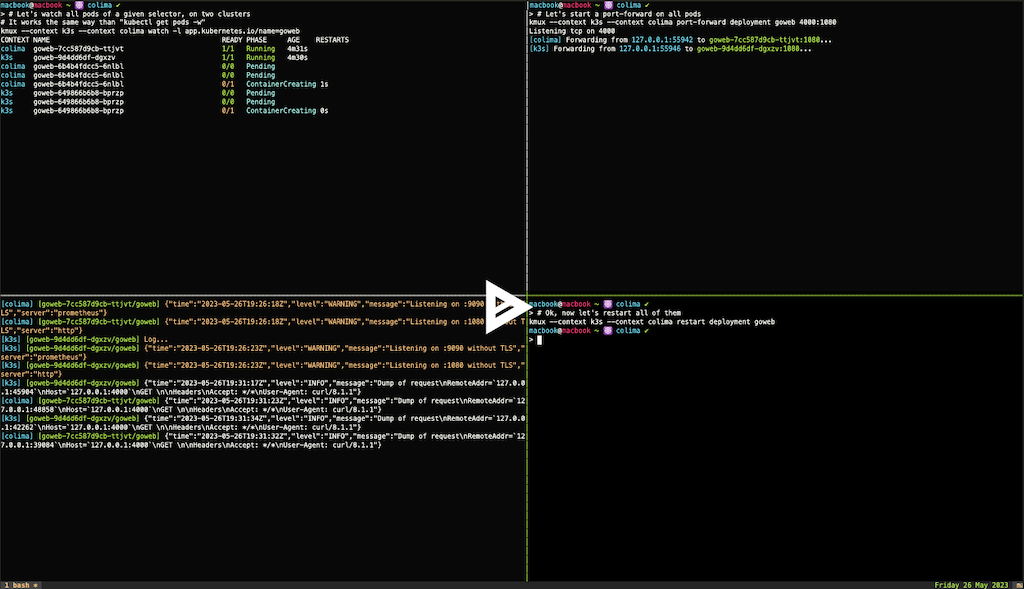
For example when you have multiple Kubernetes clusters you want to tail the logs of the same deployment simultaneously, or check the image deployed on each cluster.
Getting started
Release
Download the latest binary for your os and architecture from the GitHub Releases page
curl \
  --disable \
  --silent \
  --show-error \
  --location \
  --max-time 300 \
  "https://github.com/ViBiOh/kmux/releases/latest/download/kmux_$(uname -s | tr "[:upper:]" "[:lower:]")_$(uname -m | tr "[:upper:]" "[:lower:]" | sed "s|aarch64|arm64|").tar.gz" | tar -xz "kmux"
mv "kmux" "/usr/local/bin/kmux"
Golang
go install "github.com/ViBiOh/kmux@latest"
Shell completions
Shell completions are available by running the following command (example is for bash, but it’s available for zsh, fish and powershell).
source <(kmux completion bash)
You can also put in a dedicated file and source it from your *sh.rc
Features
Because the goal of this tool is to be used on multiple clusters at once, we rely on high-level object name (object that templatize pods, e.g. deployments, daemonset, etc.).
For running on multiple clusters at once, set the --context flag multiple times.
kmux --context central1 --context europe1 --context asia1 watch
Global Flags:
  -A, --all-namespaces      Find resources in all namespaces
      --context strings     Kubernetes context, multiple for multiplexing commands
      --kubeconfig string   Kubernetes configuration file, : separated (default "${HOME}/.kube/config", or $KUBECONFIG)
  -n, --namespace string    Override kubernetes namespace in context
--kubeconfig accepts a list of files, following the same precedence rules as kubectl, and falls back to $KUBECONFIG then ${HOME}/.kube/config.
Every flag can also be set from the environment, prefixed with KMUX_: KMUX_NAMESPACE, KMUX_CONTEXT, KMUX_GREPCOLOR, etc.
--all-namespaces only applies to commands searching for pods (watch, log, port-forward). Commands acting on one named resource (image, env, scale, restart) need a namespace and reject it.
log
log command open a pod’s watcher on a resource (Deployment, Service, CronJob, etc) by using label or field selector and stream every container’s logs of every pod it finds. New pods matching the selector are automatically streamed. Logs are streamed by default (the --follow option in regular kubectl).
Each log line has a prefix of the pod’s name and the container name, and also the context’s name if there are multiple contexts. These kind of metadatas are written to the stderr, this way, if you have logs in JSON, you can pipe kmux output into jq for example for extracting wanted data from logs (instead of using --grep or native grep). You can also remove completely the prefixes by setting --raw-output option.
If your logs are in JSON, you can also filter output based on their color:
- 🟥
red: HTTP/5xx orERROR,CRITICALorFATALlevel (case insensitive) - 🟨
yellow: HTTP/4xx orWARN[ING]level (case insensitive) - ⬜️
white: Regular log (or unidentified) - 🟩
green: HTTP/3xx orDEBUG,TRACElevel (case insensitive)
Log levels and HTTP Status codes are determined by searching for keys defined in options --statusCodeKeys and --levelKeys. The most common values are defined by default. First match of level or http status code determine the color. Only keys of the root JSON object are considered, a nested object or a value equal to one of these keys is ignored.
--grepColor accepts red, yellow, white or green and errors on anything else.
The --container can be set to restrict output to the given containers’ name.
Get logs of a given resource

Usage:
  kmux log TYPE NAME [flags]

Aliases:
  log, logs

Flags:
  -c, --container string          Filter container's name by regexp, default to all containers
  -d, --dry-run                   Dry-run, print only pods
  -g, --grep strings              Regexp to filter log
      --grepColor string          Get logs only above given color (red > yellow > green)
  -v, --invert-match              Invert regexp filter matching
      --levelKeys strings         Keys for level in JSON (default [level,severity])
      --no-follow                 Don't follow logs
  -r, --raw-output                Raw output, don't print context or pod prefixes
  -l, --selector stringToString   Labels to filter pods (default [])
  -s, --since duration            Display logs since given duration (default 1h0m0s)
      --statusCodeKeys strings    Keys for HTTP Status code in JSON (default [status,statusCode,response_code,http_status,OriginStatus])
port-forward
Like log, port-forward command open a pod’s watcher on a resource and port-forward to every container matching port and being ready. New pods matching the selector are automatically streamed.
A local tcp load-balancer is started on given local port that will forward to underlying pods by using round-robin algorithm. The local port is bound before any pod is forwarded, so a port already in use is reported right away.
The local_port must be numeric, the remote_port can also be the name of a container’s port.
Port forward to pods of a resource

Usage:
  kmux port-forward TYPE NAME [local_port:]remote_port [flags]

Aliases:
  port-forward, forward

Flags:
  -d, --dry-run     Dry-run, print only pods
      --limit uint  Limit forward to only n pods
watch
watch for all pods in a given namespace (or all namespaces). Status phase is done in a nearly same way that the official kubectl (computing the status of a Pod is not that easy).
Output is colored according to the current status of the pod, for better clarity.
Get all pods in the namespace

Usage:
  kmux watch [flags]

Flags:
  -L, --label-columns strings     Labels that are going to be presented as columns
  -o, --output string             Output format. One of: (wide)
  -l, --selector stringToString   Labels to filter pods (default [])
      --show-annotations          Show all annotations as the last column (after labels if both asked)
      --show-labels               Show all labels as the last column
restart
restart performs the equivalent of a rollout restart on given resource, by adding the kmux.vibioh.fr/restartedAt annotation (and kmux.vibioh.fr/restartedBy with --user) on the pod spec. For job, it’s the equivalent of a replacement: the job is deleted, waited for, then created again. A job cannot be patched, so if the creation fails after the deletion, the job is reported as deleted and has to be applied again.
Restart the given resource

Usage:
  kmux restart TYPE NAME [flags]

Flags:
  -u, --user string   User added in the restartedBy annotation (read from $KMUX_USER)
image
image prints the image name of all containers found in given resource. The idea is to check that every cluster runs the same version.
Get all image names of containers for a given resource

Usage:
  kmux image TYPE NAME [flags]

Flags:
  -c, --container string   Filter container's name by regexp, default to all containers
env
env prints the configured environment variables from the given resource. When a value is dynamic (e.g. hostIP, podIP, etc.), the value from the most “live” pod is retrieved.
Values coming from a Secret are printed in clear text, be careful when sharing the output.
Get all configured environment variables of containers for a given resource

Usage:
  kmux env TYPE NAME [flags]

Flags:
  -c, --container string   Filter container's name by regexp, default to all containers
scale
scale changes the replicas field on a replicable resource (deployment, replicaset, statefulset). It works by using a scale factor, you don’t need to know the current replicas count.
The factor must be positive and is applied on the current count, rounded up. A resource already scaled to zero counts as one, so --factor 2 starts it back with two pods.
Scale a resource by a given factor

Usage:
  kmux scale TYPE NAME [flags]

Flags:
      --factor float   Scale factor, e.g. 0 to go down to zero, 1.5 for 50% more, 2 to double the size (default 1)
      --force          Acknowledge downscaling to zero